
Audio Dashboards
This post is about Audio Dashboards, a technique we devised at Tsugi to improve the game audio workflow of our clients.
Where it came from
At Tsugi, we provide consulting services to game studios. We visit their audio departments, sit down with the sound designers and try to get a better understanding of their workflow, both in general and in the context of their current project: what are their most common tasks, how do they tackle them, what are the bottlenecks and what technologies are they missing. We then write a report and make recommendations. The team can implement these changes with our help, ask us to do it for them or just leave it at that for the time being. Often, we end up developing new types of tools in the process, which is exactly what happened with the Audio Dashboards.
The idea for the Audio Dashboards came from a couple of observations during these visits:
– Often, the GUI of the audio middleware / internal tool is not the most adequate for the project or for the team. A middleware company must cater to the wishes of the many and their solution cannot be the most efficient or intuitive for a given project. As for audio internal tools, they are often considered fine as long as they can export the data correctly.
– In mid-sized audio teams and bigger audio departments, it is not rare to have sound designers working on a specific type of content for a game: Foley, weapons, ambiences etc… Therefore, they always use the same subset of features of the middleware and the other ones are in the way.
– Sometimes the information the sound designers need is simply not available in the tool, or they would like to see it presented in a different way. Maybe they would like to see a pie chart representing the memory consumption per sound bank. Or maybe they would like a more immediate and graphic way to setup random containers and assign a weight to the different assets.
What it is
What we call Audio Dashboards at Tsugi are actually simple software layers that give you the information you want (and only that) while offering a better interface (more intuitive, more productive) to do your work. They are custom-made standalone applications that you run on the top (or instead) of the middleware or internal audio tool and that export data towards them.
An Audio Dashboard can serve as a façade to one or several tools simultaneously and they don’t have to be limited to audio. For example, a sound designer working on ambiences could have a dashboard which includes parameters linked to the level editor of his or her game. Similarly, the dashboard for a sound designer working on first-person Foley could get some input from an animation tool. Of course, this assumes that we can communicate in some way with the other software or at the very least read its project files.
Useful features can be added to the Audio Dashboard itself, like VST hosting, allowing you to process your assets with a VST plug-in chain specific to your project (and saving you the multiple switches between your audio middleware and your DAW). We can also implement your favorite input controls: map key shortcuts / mouse buttons as you want, add support for a MIDI control surface or any other input peripheral such as the Leap. Finally, statistics on banks can be generated and various reports exported, which makes Audio Dashboards very useful tools for any audio director wanting to keep track of a project without having to dive in all the implementation details.
An example
Here is an example of a very simple interface that we imagined for a client to create dynamic sound effects or dialogue.
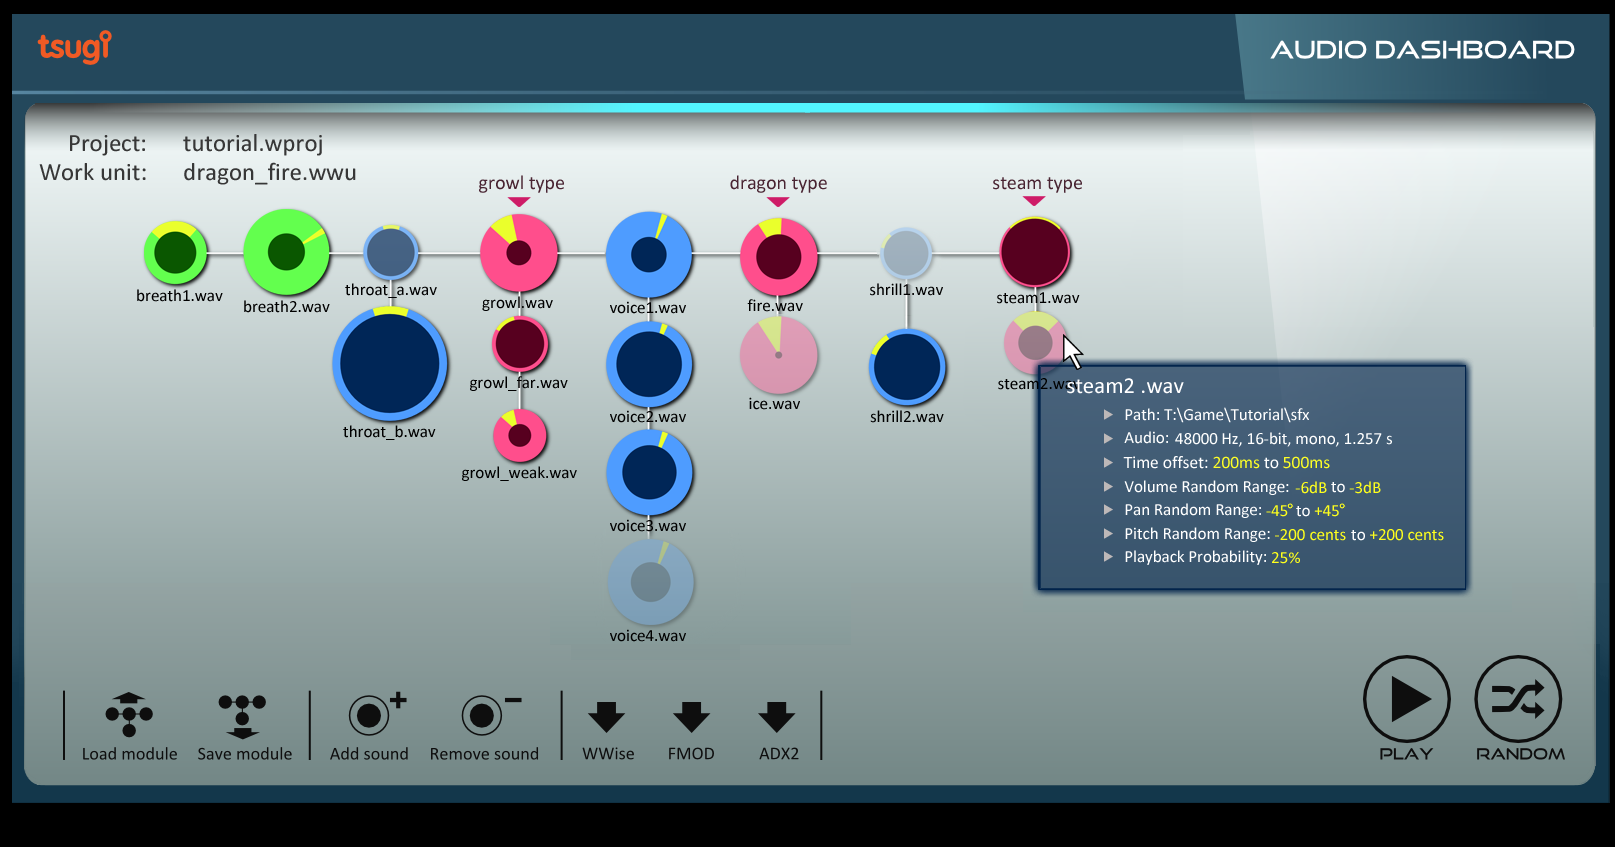
You can drag and drop samples directly on the work pane (they will be automatically added to the banks and all the intermediary objects such as containers for Wwise or Cues for ADX2 will be created later as well). The samples are represented by colored circles. They are organized horizontally (sequencing) and vertically (selection). The colors indicate their behavior (green = single sample that is always played, blue = randomized samples, pinkish = samples selected from a game input). The size of a circle corresponds to the volume of the sample, and its opacity to the probability that it will be selected. On this picture, random ranges for volume and pan are also visible.
There is no information about the underlying data structure (containers, switches, how they are connected etc…) because it should not be the first thing a sound designer has to think about. Very complex behaviors can be defined easily with this interface, while the overview is always visible and understandable. Because the sound designer only has to focus on the creative part and does not have to deal with all the implementation details, it makes him/her more productive while also minimizing the risks of errors.
How it works
In all the Audio Dashboards, we first select a game audio project (e.g. .wproj for Wwise, .fspro for FMOD Studio or atmcproject for ADX2). From there, we can read the information about the structure of the project, the individual work units etc… This will allow us to get access to any existing data we would like to reference and also to make sure that there are no conflicts (names, IDs…) between the data we are generating and the data currently in the project.
Once the sound designer is done editing the data, we build the intermediary audio objects that correspond to what he did and then export them to the middleware. New banks are created if needed, samples are copied, random containers are built, volume, pitch, pan and filter settings are assigned to sound events etc…
This is made easier by the fact that now all the main game audio middleware use separate files (XML or XML-like such as Orca) to store their sound objects, and not a giant monolithic project file (as it was for example the case with the previous generation of tools like FMOD Designer or the former version of ADX2).
This brings us to another interesting benefit of having a façade. It can serve as a common interface from which to export to various run-times. Having a similar editing experience whatever your engine is can definitely save a lot of time, especially if you switch middleware mid-project or between two installments of the same franchise (and have a lot of assets to port). A lot of the features are similar between the middleware tools (packaging of samples in banks, randomization, volume, pan, pitch, filter parameters etc…) so it is relatively easy to export to all of them from a single interface. Moreover, at Tsugi we already developed a special library that interfaces with the three main game audio middleware. All our software from professional to hobbyist level is able to import or export data for ADX2, Fmod and Wwise.
Before concluding, a point worth mentioning is playback within the dashboard. Several methods can be used. Some middleware or internal audio tools provide you with an API to control them, in some other cases we are able to call the bank creation command line utility and use a minimal run-time to play the sound. In some cases it’s not such a big deal and you simply create your assets on the dashboard and just switch to the tool to play. In cases such as the example described above – or if you just want to test how a random container will sound and adjust the different weights – the playback can be coded as part of the dashboard itself.
If you have questions about the concept of Audio Dashboards or you think your audio department could benefit from our help designing one (or if you want us to look at other ways to improve your game audio workflow), feel free to contact me directly or Tsugi through the contact form.